When you are viewing your presentation at runtime, you can zoom in to get a close-up view of your slide or the items that your slide contains or zoom out to see more of the slide or its items at a reduced size. You can zoom using the zoom facilities associated with your browser, select and reverse the full screen option from the panel tools and slide navigation, see more and less of your map, and zoom in to only a specified section of your chart's range.
Runtime zoom
You can use the native functionality associated with your browser to zoom in and out of your current slide.
You can also use the Full Screen option, to fill the whole of the available space with your presentation (with the current slide selected) or with any individual visuals that may be present on your slide.
Show a slide in full screen mode
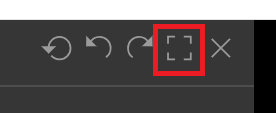
From the Runtime Interactions (typically shown at the top-right of your slides), click the Full Screen option (red) to use all available screen space for your presentation:
 Click Exit Full Screen Mode or click
 Esc to exit full screen mode and return to the runtime presentation at normal size.
Tip: Although these options are typically at the top-right of each slide, Present Pro users can reposition them when editing the Master.
Show visual panel in full screen mode
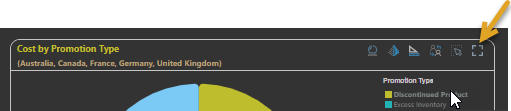
If your presentation includes visuals, you can typically access the panel tools for each visual by hovering over the panel at runtime:
- Click the Full Screen option (orange arrow below) to use all available screen space for one of the visuals on your presentation.
Visual-specific zoom facilities
There are some runtime zoom tools that are associated with particular visualization types.
Map zoom
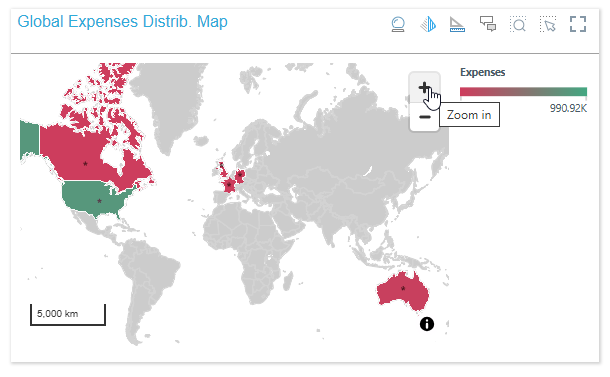
If one of your visuals is a map, you can zoom in and out of your map at runtime:
- Using the scroll wheel on your mouse.
- If the designer of the visual added Zoom Control buttons to your map in Discover, you can use them to zoom in and out:
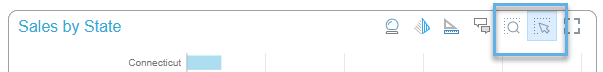
- You can also use the Panel Tools (blue highlight below) to zoom in or focus on areas of your map. For more information, see Panel tools at runtime.
Range slider
You can use this facility to zoom in to a particular section of your Cartesian chart and view its details. Note that this feature is particularly useful for charts that show a large amount of data; for example, bar charts containing details by date or column charts showing sales by a large number of products.
Note: Line charts, Area charts, and Bar charts may include a horizontal range slider; and Column charts may include a vertical range slider. If you are editing the range slider in Discover Pro, you can configure whether the slider should be added above or below the chart (in the case of horizontal range sliders) or to its left or right (in the case of vertical range sliders).
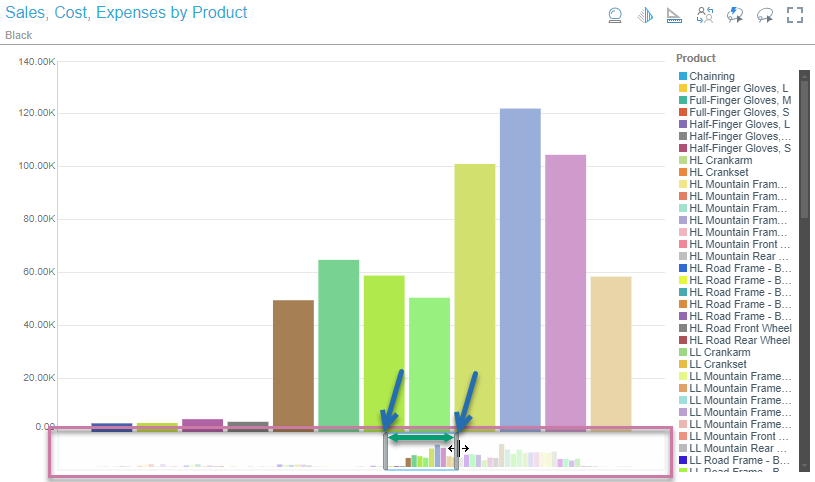
Show the range slider
If the range slider has been enabled in Discover Pro or Present Pro at design time, it is shown in the visual panel by default (purple highlight).
Where the range slider has not been enabled at design time, right-click the visual and select Extended Operations > Show Range Slider from the context menu.
Change range slider scope and zoom
To select the scope of your view, drag the handles to the left and right of the x-axis (blue arrows). The larger the space between the two handles (green arrow), the more you can see of the chart in the panel. Note: You can drag the selection left and right by dragging the space between the two handles.
To open the slider range context menu, right-click anywhere on the slider. The options are:
- Zoom Out: Zoom all the way out to include the entire data range.
- Auto Zoom: Zoom in, letting Pyramid decide the optimal zoom size.
- Turn off Mini-Preview: Remove the mini preview of the chart from the range slider.
- Hide Range Slider: Hide the range slider.